
Articles from the category
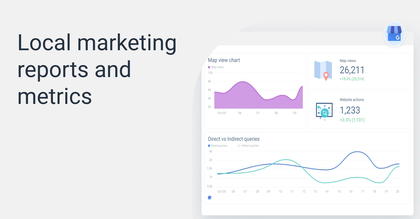
KPIs & metrics
Building blocks to a successful marketing strategy
Explore the blog


KPIs & metrics · 11 mins
KPI analytics to measure ROI

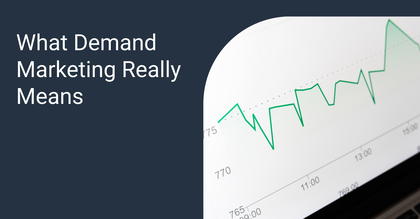
KPIs & metrics · 8 mins
What is demand marketing?
Browse all categories
Get marketing insights direct to your inbox
By submitting this form, you agree to our privacy policy