OKR Template
OKRs or objectives and key results are a planning and goal-setting method that helps focus your efforts and work to align with overall company objectives. You can use the Whatagraph OKR template to define the measurable steps you’ll take towards achieving goals within your firm or for your clients


Spend more time driving better results for your clients
Objective results in one place
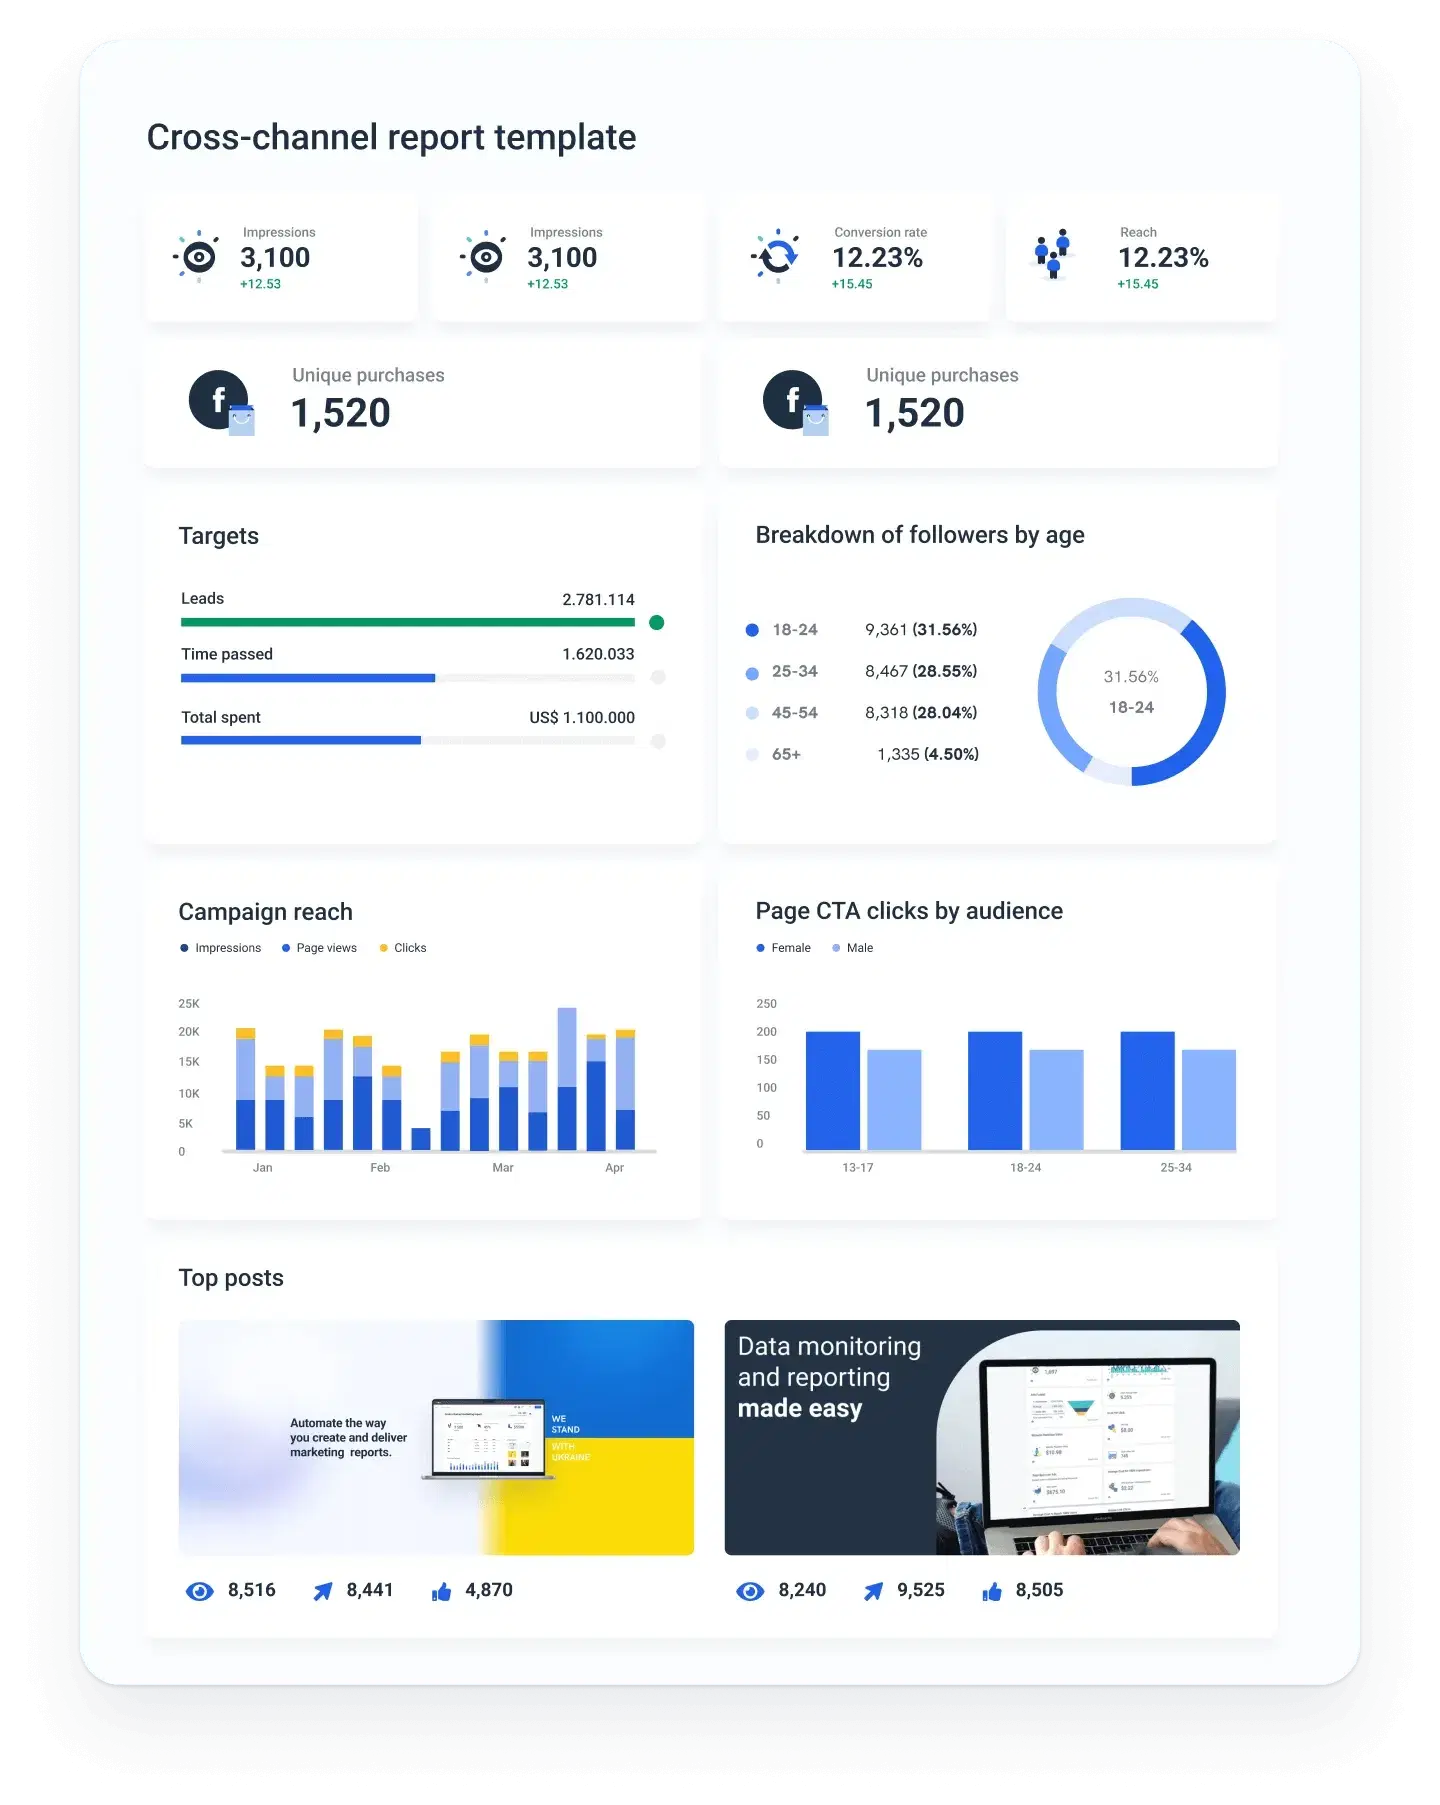
Easily set, manage, and track long-term objectives and goals of your firm or tasks assigned by your client. View the primary objectives of your company, department, teams, and people using our pre-made widgets.
You can quickly drag and drop desired widgets to view all the key metrics your heart desires - CPA, churn rate, budget expenditures, and much more.

Great customization options
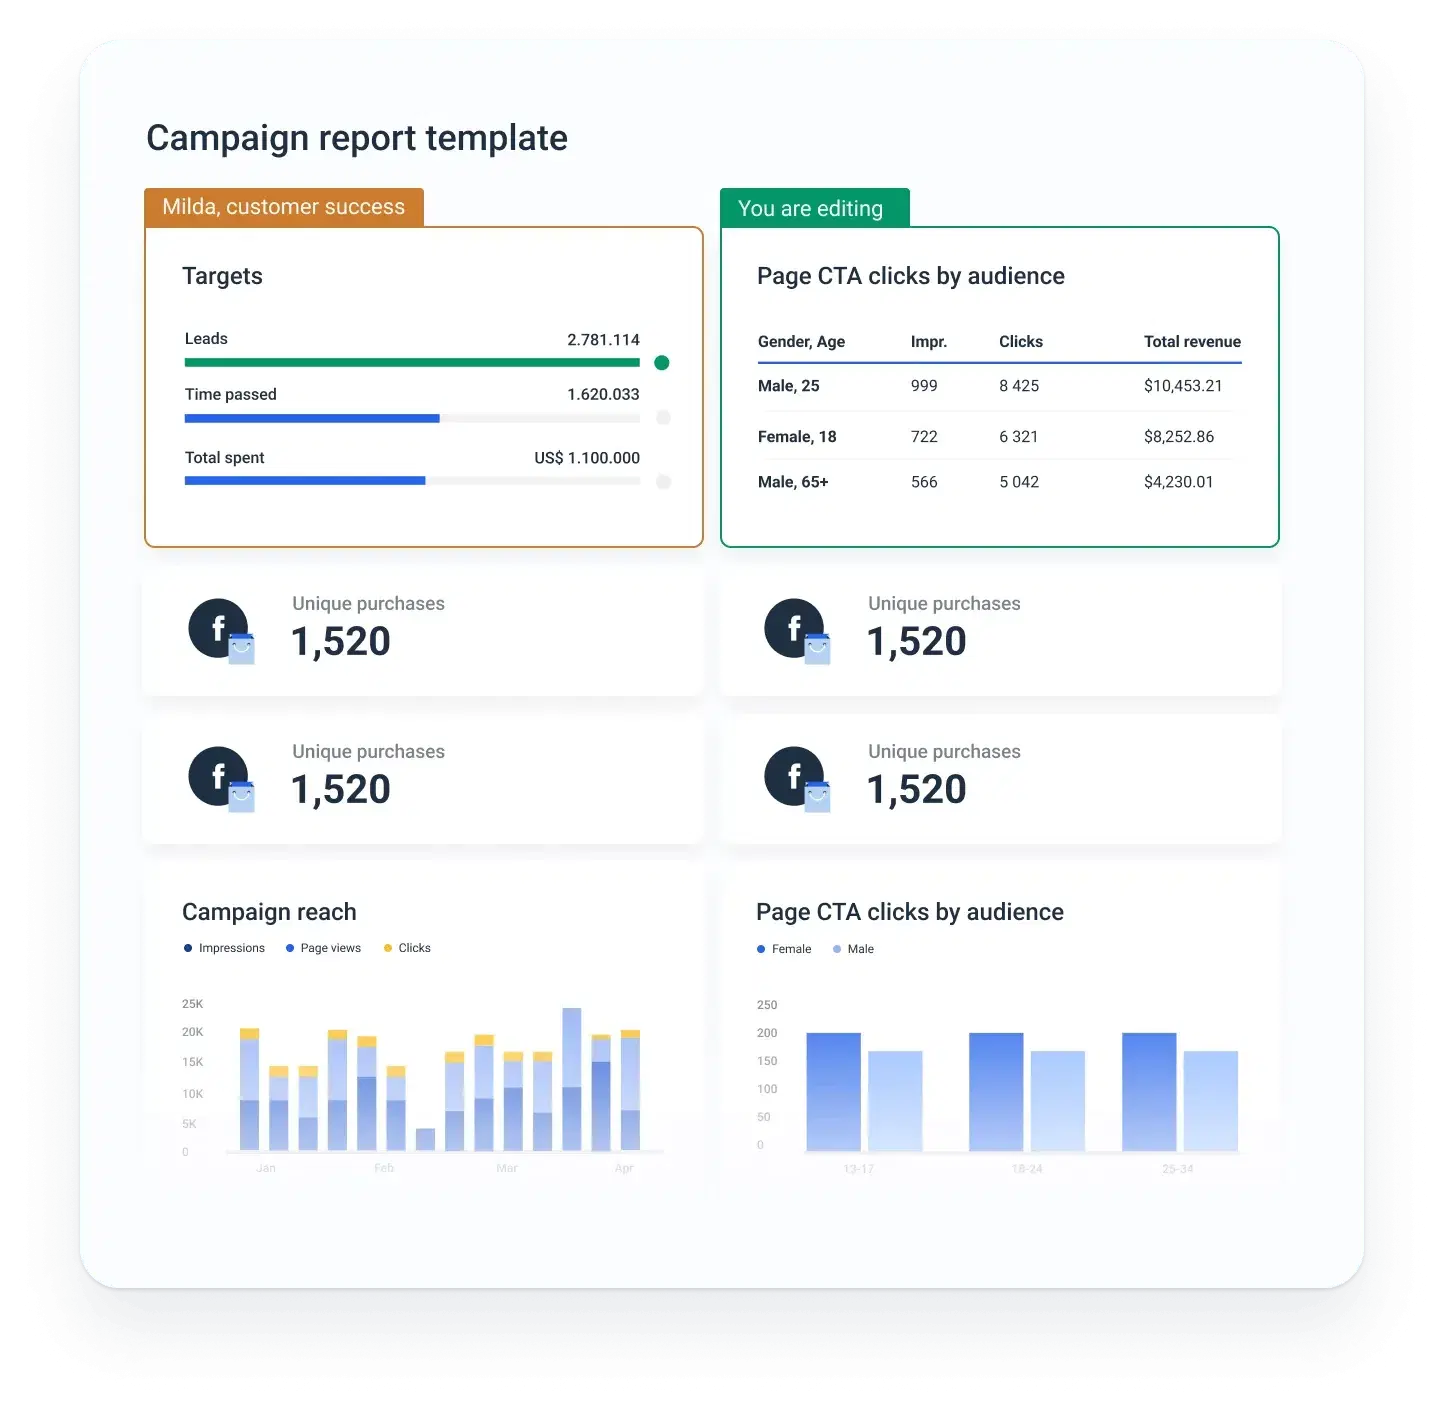
Upload your company logo, build custom color schemes, and stunning visuals. Whether you prefer to create reports from scratch using our drag-and-drop editor or use our pre-built templates, your options for creating unique, white-label reports are endless.
Choose the data that you think is most important and present it in an eye-catching, user-friendly way - your clients and colleagues will love you for it!

Automated report delivery
Understand company-wide progress at a glance with our comprehensive and visual OKR template. Create weekly, monthly or quarterly reports and have them automatically delivered to a specified email.

It’s good to be loved! Our clients are not shy about expressing it.
I made a switch from GDS and Sheets for reporting to Whatagraph, and I am saving literal hours each week on performance report creation. Our small firm actually managed to onboard 2 new clients as a result of all the time we saved on managing data and reporting. The customer service is also really helpful and easy to reach.

Capterra verified review by
Mindaugas S., Marketing Consultant
Having active customer support to help fix any issues was a big contributor, but we also really liked the ability to save templates and connect sources to multiple charts/widgets at once without having to edit them individually. And having the grid layout is much easier to stay consistent with than the free form setup that Data Studio has.

Capterra verified review by
Nico T., Media Planner
The system has standard templates that are easy and fast to use. Also you can build your own report with lightning speed. It is very easy to use, has a lot of integration, and let get started very fast.

Capterra verified review by
Rasmus Bernt K., External Senior Management Consultant
We love Whatagraph - we would definitely recommend and our account manager is great! I love how easy this tool is to use, everyone on the team finds it much more user-friendly than other dashboards. Integration was easy, we sent some example reports to the team who duplicated these for us. We literally had to log in and send it to our clients!

Capterra verified review by
Stephanie S., Digital Director
We are showing our clients the work that we're doing for them and this is incredibly important for our clients ROI. They want to see results and having a tool like Whatagraph that can show data from virtually every source we use is hugely important.

Capterra verified review by
John S., SEO Strategist
The tool is easy to use; you do not need to have development resources. Even my junior project managers are capable of making campaign reports in minutes. There are a lot of pre-made templates you can use as well as many pre-made widgets.

Capterra verified review by
Erman E., Marketing Specialist
Really easy to connect data sources within the tool. The library of report templates has been helpful. The customer support team has been responsive to all of our needs. Our team enjoys the simplicity of setting up the reports and how the data is presented.

Capterra verified review by
Brent N., Director of Operations
Easy to create really beautiful graphs and reports which can help other team members to understand the most important takeaways. I especially like the automated report function, so I don't have to check on the same thing repeatedly.

Capterra verified review by
Orsolya S., Online Marketing Manager
Need more help with getting started?
We can set up your report campaign for you!
Ready for insights?
It's time to focus your time on the tasks that really matter, and let us worry about your marketing analytics. Start your free 7-day trial.
- Free for 7 days
- No credit card required
- Live chat support
- Cancel anytime
No credit card required